This is a guest blog post by one of my Cisco CCIE colleagues Adam Stuart on his view of Azure Network Watcher.
What is it?
Azure Network Watcher is a feature within Microsoft Azure to make consumption of network data/troubleshooting easier.
How much does it cost?
Free until August 1st.
Then
- 5GB free network logs p/m, with small overcharge for extra GB
- 1000 checks p/m, small overcharge per extra 1000 checks
Plus storage costs for log retention.
What Does It Do?
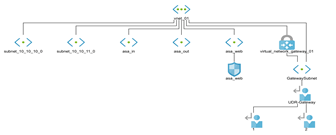
- Monitoring Topology – Shows a very basic network topology diagram, no further drill down is possible. To exactly useful but better than nothing.
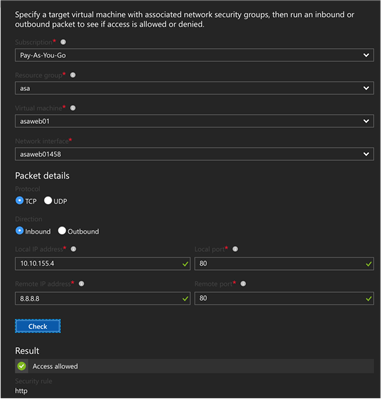
- Diagnostics – IP Flow Verify, simple packet trace function to test is a source/destination is allowed via a NSG policy. Equivalent of packet trace in Cisco land. Quite useful if you have lots of NSG. Overall a good sanity check.
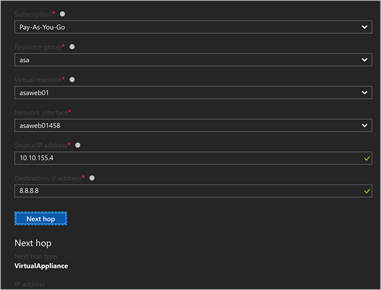
- Diagnostics – Next Hop, simple utility to verify next hop as per effective routing table. This would be useful for a customer using Network Virtual Appliance (NVA) Firewalls and complex UDR. It provides insight into the Azure routing service which is otherwise tricky to obtain.
- Diagnostics – Provides details of NVA specific to network interface of VM. Not useful unless you have overlapping NSG on a NIC and subnet and wanted to see the result of an aggregate policy
- Diagnostics – Packet Capture, this is essentially an easier way to run tcpdump and get pcap files form virtual machines. Note, you need to install a VM extension* to get this to work see here.
- Logs – NSG Flow Logs, the equivalent of checking Access-list log on a normal firewall. This is the primary function that most customer will be after. To answer the question “is the firewall blocking it”? Enabled on a per NSG basis, logs to a container in blob storage, which you export as JSON format. This is probably quite powerful, but the default output is not very accessible. JSON format logs require another parser to provide any real value.
