What is VAAI?

This is more of a post for myself going over VAAI before I take my VCP 5 exam soon, so I wanted to get some pixels on the screen about VAAI.

VAAI stands for vSphere Storage API’s for Array Integration.  It has been around since vSphere 4.1 and is used to ‘pass’ storage related functions to the array rather than being performed by ESXi.

Some of the benefits from using VAAI are:

Hardware Accelerated Full Copy tasks such as power on VM’s or cloning VM’s are more efficient.

Hardware Accelerated Block Zeroing if you create a disk using ‘Thick Provisioned’ Lazy Zeroed, then the array will take the responsibility to write the zero’s instead of ESXi.

Thin Provisioning perhaps the most important one.  ESXi5 know’s that a LUN has been thin provisioned and can reclaim dead space.  Why is this important? Well imagine you put a 4GB ISO file onto a production VM to install a third party piece of software. After the software has been installed, you delete the ISO file, but how does the array know that the 4GB of space can be reclaimed? The operating system doesn’t tell ESXi5 or the array to reclaim the space as it’s no longer used, instead it comes from the T10 UNMAP command.

How do we know if our SAN is VAAI supported? If you go to Storage > Devices and look at the Hardware Acceleration Column, you are looking for ‘supported’.

We commonly use HP SAN’s and different levels of SAN Management Software will have VAAI support for example HP P4000, need SANiQ version 9 or above to support VAAI (9.5 is out).

Naturally, as we are all IT professionals we regularly update the firmware on all of our devices!

London VMUG Meeting – Thursday 19th July 2012

The next London VMware User Group meeting is on Thursday 19th July 2012.

Meeting Highlights

  • Centrix Software Presentation
  • Fusion-IO Presentation
  • Whiptail Presentation
  • EMC Labs Throughout the Day
  • Lee Dilworth – VMware Availability Update: vSphere Replication, Stretched Clusters and BCDR
  • Darren Woollard and Gregg Robertson – vSphere Nerdknobs
  • Chris Evans – The Storage Architect’s View
  • Chris Gale – Fusion-IO More Desktops. More Virtual Machines. More Data-Intensive Applications. Faster. Cheaper. Simpler.
  • Matt Northam and Simon Hansford – Government Can Run vCloud, How Skyscape Did It
  • Martyn Storey – VMware NDA Roadmap Session

For registration and further details click me

Cisco 4510 & E1000 Virtual NIC Latency Issues

We received a report from a client that the local site Exchange DAG had been falling over on a regular basis.

After some investigation we noticed that Exchange 2010 had changed from block level replication to file level replication with Event ID 10036, MSExchangeIS Mailbox Store

‘Continuos replication block mode is unable to keep up with the data generation rate. Block mode has been suspended, and file mode has been resumed’.

We performed various tests and the net result that a ping from one DAG member to the other resulted in > 4ms latency.  Not good!

This meant that when the Exchange 2010 cluster threshold was reached which is latency above 1ms for a period of 5 seconds, the DAG failed over, causing users Outlook clients having to relocate which server they mailbox resided on.

For a quick fix we changed ran the following Exchange 2010 Power Shell commands:

cluster /list

cluster.exe ‘cluster name’ /prop

Increased the SameSubnetDelay threshold by running:

/cluster.exe /cluster:’cluster name’ /prop samesubnetdelay=2000
/cluster.exe /cluster:’cluster name’ /prop samesubnetthreshold=2000

This means that the DAG will no longer failover, however it doesn’t resolve the underlying issue with the network latency.

I was concerned from a vSphere perspective as the client has vCentre Operations Manager which hadn’t alerted on any issues with bandwidth utilisation and the no other latency issues had been reported by end users.

What did I do to diagnose the issue? As it’s always good to know your peers thought process!

– Checked all vSwitches Uplinks to make sure no configuration changes had been made and that they all reported back as 1000 Full – Pass

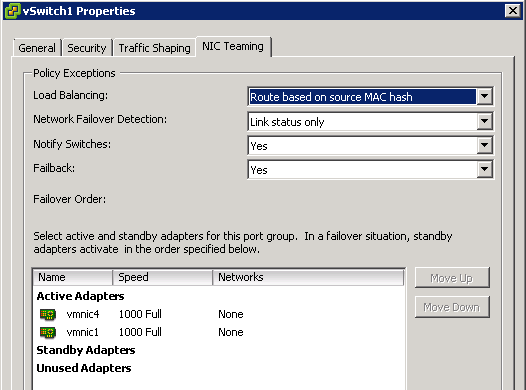
– Checked Load Balancing on vSwitches, default as ‘route based on originating virtual port ID’ – Pass

– Checked Network Utilisation in Exchange VM’s, all reporting < 10 Mpbs – Pass

– Checked Performance Charts for Network Utilisation on ESXi Hosts, not above 300 Mbps for past month- Pass

– Checked ESXTOP, to ensure that VM’s correctly balanced across uplinks see post What NIC is my virtual server using – Pass

– Checked physical servers on same LAN which always reported back <1ms response times – Pass

– Checked CPU/Memory utilisation on Cisco 4510 switches all below 20% – Pass

– Checked VMware Update Manager, some hosts needed updates (7 in total) – Failed

My colleague was looking at various port counters on the Cisco 4510 switches and he noticed that flow control was enabled and the TXPause counter was increasing on the ports that the ESXi hosts where connected.  We turned off flow control and didn’t notice any difference.

By default Flow Control is enabled on ESX and ESXi but only comes into play if the switch you are connected too supports it, see this article

We updated all of the ESXi Hosts using VUM as it had various E1000 adapter updates.  However the issues continued to persist.

At this point, we knew this issue wasn’t going to be a quick fix and would require some more investigation as the issue could be any of the following:

– E1000 vNIC
– Cisco 4510
– Broadcom NetXtreme II BCM5709 (standard for HP and Dell servers for onboard NIC)

On this particular configuration we have HP2810G switches which are isolated from the LAN and are used for vMotion, Fault Tolerance Logging and MS Clustering Heartbeats.

Step 1 – Pass

We setup a couple of test VM’s on different ESXi Hosts and created a new ‘test’ vSwitch using an Intel 82571EB Adapter with VMXNET3 adapters on an isolated VLAN.  Monitored this for a day we received all response times <1ms.

Step 2 – Pass

To ensure that the TCP/IP stack in Windows 2008 R2 VM’s was reset and to remove those pesky hidden network adapters, we ran the following commands:

netsh winsock reset
netsh int ip reset

Removed Intel 82571EB Adapter from ‘test’ vSwitch and replaced with a Broadcom NetXtreme II BCM5709 VMXNET3 adapters on an isolated VLAN.  Monitored this for a day we recieved all response times <1ms.

Step 3 – Fail

Ran the same TCP/IP commands for Windows 2008 R2 VM’s.

netsh winsock reset
netsh int ip reset

Stayed with the Broadcom NetXtreme II BCM5709 bu changed vNIC to E1000 adapters on an isolated VLAN. Monitored this for a day we recieved some response times <4ms.

Step 4 – Fail

We now know that the E1000 vNIC was a cause of the issue, however we needed to go back to the VMXNET3 on the main LAN.

Again we ran reset the TCP/IP stack to remove any hidden network adapters.

Stayed with the Broadcom NetXtreme II BCM5709 bu changed vNIC to VMXNET3 adapters on LAN. Monitored this for a day we received all response times <3ms.

Conclusion

What have we learnt? Well the first thing is to change the virtual machine vNICs to VMXNET3 which reduces the latency across the LAN, however this is not acceptable as it should always be <1ms unless you have a broadcast storm.

The second thing is to replace the 4510’s, as they have been end of life for over 2 years.

VTSP 5

Bit of a strange one really, I was all prepared to crack on and go over the VMware Technical Sales Professional 5 training in VMware Partner University.

Logged in and added the VTSP 5 to ‘my Plan’.  Much to my surprise it then said I had met all the pre requisites and I’m now a VTSP 5.

Slightly easier than I imagined!

High Availabity for vMotion Across Two NIC’s

When designing your vCentre environment, good practice is to associate two physical network adapters (uplinks) to your vMotion network for redundancy.

The question is does VMware use both uplinks in aggregation to give you 2GBps throughput in an Active/Active configuration? the answer to this is no.

In the above configuration we have two uplinks both Active, using the load balancing policy ‘route based on originating virtual port ID’ this means that the VMkernel will use one of the two uplinks for vMotion traffic.  The secondary active adapter will be used but only if the uplink vmnic4 is no longer available.

You might say this is OK, I’m happy with this configuration, I say how can we make it more efficient?

At the moment you will have a single Port Group in your vSwitch which is providing vMotion functionality (in my case it’s also doing Fault Tolerance Logging)

And the vSWitch has two Active Adapters

What we are going to do is rename the Port Group vMotionFT to vMotionFT1, go into the Port Groups properties and change the NIC Teaming setting to the following:

So what have we changed and why? First of all we have over ridden the switch failover order, we have specified that vmnic4 is now unused and that we are not going to ‘failback’ in the event of uplink failure.

You may think hold on Craig, why have you done this now we have no HA for our uplinks, well the next step is going to be adding another Port Group as follows:

VMkernel Select
Network Label vMotionFT2
Use this port group for vMotion Select
Use this port group for Fault Tolerance logging Do Not Select
IP Address 192.168.231.8 255.255.255.0

Once completed, we are now going to edit the Port Group vMotionFT2, go back into NIC Teaming and over ride the switch failover order and set vmnic1 to unused and no for failback.

So what have we achieved?

1. vSwitch1 has two active uplinks
2. vMotionFT1 Port Group is active and uses vmnic1 for vMotion & Fault Tolerance Logging
3. vMotionFT2 Port Group is active and uses vmnic4 for vMotion
4. We can perform two vMotions simultaneously using 1GB of bandwidth each
5. If we have an uplink hardware issue vMotion continues to work